
Satisfaction Score Reaches 4.53, Here’s How KAI Listens to 3.25 Million Customer Voices
Listening to customers is not just a slogan. This is proven by the results of the Customer Satisfaction Survey for the First Semester of 2026, where the Customer Satisfaction Index reached 4.53 on a scale of 5—an increase of 0.01 points compared to the 2025 figure of 4.52. This figure is not created in isolation, but is compiled from 3,160 face-to-face interviews and enriched by 3,249,842 customer voices monitored on social media during the same period.
KAI President Director Bobby Rasyidin emphasised that the company’s sustainability is built on its ability to listen, understand, and follow up on the needs of the public. For him, the voice of the customer will continue to be the main ingredient in every innovation and service development going forward, as customers provide direct perspectives that make every company decision more relevant and measurable.
This survey was conducted quite thoroughly. A total of 3,160 respondents across 9 Operational Areas and 4 Regional Divisions were interviewed directly—all of whom had used KAI services at least twice in the past six months. The scope was broad, covering experiences at stations and on trains, as well as LRT Jabodebek, LRT South Sumatra, Tourism Trains, and Public Service Obligation (PSO) trains. KAI Vice President Corporate Communication Anne Purba explained that the survey was designed to capture the entire customer journey, from searching for information, purchasing tickets, arriving at the station, the boarding process, to the experience onboard.
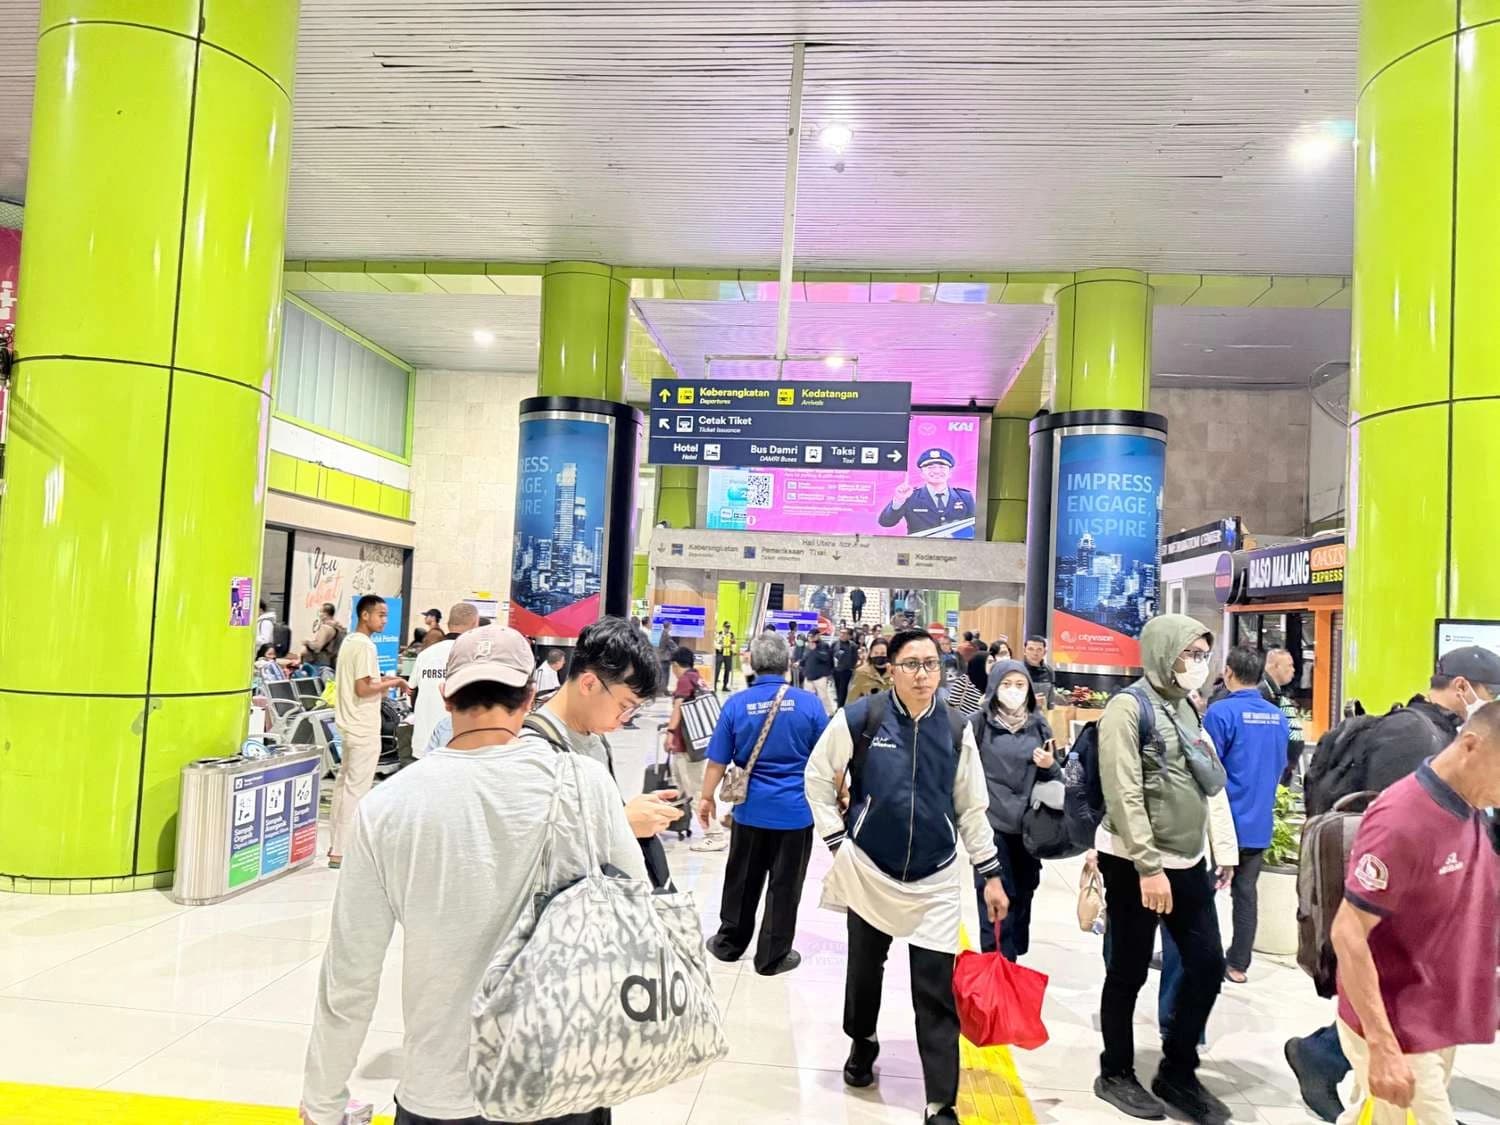
The results show a fairly encouraging trend for onboard services. The satisfaction index for this aspect increased by 0.05 points, from 4.55 in the second semester of 2025 to 4.60 in this semester. However, not all the news is positive—satisfaction with station services slightly declined from 4.50 to 4.46, becoming a specific note for KAI to strengthen facilities and customer experience in that area.
Looking deeper, staff friendliness turns out to be the top performer in two categories. Onboard, staff friendliness achieved the highest score of 4.72, followed by punctuality at 4.68, travel information at 4.61, security at 4.59, passenger cabins at 4.56, dining cars at 4.54, and toilets at 4.51. At stations, staff friendliness also ranked highest at 4.62, followed by accuracy of information and service timing at 4.57, fares and tickets at 4.50, boarding areas at 4.39, ticket purchasing at 4.38, customer service rooms at 4.37, and station waiting areas at 4.34.
Beyond formal surveys, KAI also listens to customer conversations online. During this semester, there were 3,249,842 customer voices on social media containing questions, appreciation, suggestions, criticism, and service reports. Anne noted that while surveys provide structured measurement, social media conversations offer faster and broader context—both combined help KAI understand what is appreciated and what still needs improvement.
It should be underlined that the number of customer voices differs from the number of interactions actually handled through official service channels. During the first semester of 2026, there were 2,205,691 customer interactions, including 1,380,724 social media interactions, 132,981 email interactions, 231,030 WhatsApp interactions, 16,764 outbound communications, and 444,192 inbound communications. Combined with around 11.28 million interactions handled during 2022–2025, the cumulative total of customer interactions through KAI service channels up to this semester has reached approximately 13.49 million interactions.
Using the Importance–Performance Analysis method, KAI mapped which aspects are considered important by customers but not yet fully satisfying. From this, five priority improvement areas emerged: station waiting areas, boarding areas, customer service rooms, fares and tickets, and onboard train toilets.
Regarding station waiting areas, customers pay close attention to basic aspects such as comfort, cleanliness, seating availability, lighting, and room temperature. In boarding areas, attention focuses on cleanliness, facilities, process flow, and ease of using the Face Recognition Boarding Gate. Meanwhile, in customer service rooms, key concerns include the availability of desks and chairs, queue seating, queue numbering systems, and overall room comfort. For fares and tickets, customers focus on price suitability, class variety, ease of purchase, and clarity of travel rules—while for onboard toilets, attention is very detailed, ranging from cleanliness, water availability, jet showers, tissues, hand soap, bins, to air fresheners.
Interestingly, service performance also varies by region. Daop 3 Cirebon emerged as the top performer with the highest service object CSI of 4.71, resulting from a combination of station CSI at 4.63 and onboard CSI at 4.79. Daop 3 Cirebon also led in two other categories: the highest physical aspect score at 4.61 and the highest non-physical aspect score at 4.82. Meanwhile, Daop 5 Purwokerto stood out with the largest CSI increase, rising by 0.28 points from the previous survey.
For cleanliness, Cirebon Station and Surabaya Pasar Turi Station both achieved the highest score of 4.58 in station cleanliness. Meanwhile, for onboard cleanliness by region, Daop 6 Yogyakarta ranked highest with a score of 4.76.
All of these findings will serve as references for follow-up actions at the central, operational area (Daop), and regional division (Divre) levels. Anne concluded by emphasising that KAI’s target is to maintain aspects already rated positively by customers, while accelerating improvements in service points that still require attention, so that every development carried out can truly be felt in every customer journey.