
KAI’s Customer Satisfaction Index Reaches 4.53, with 3.25 Million Customer Feedback Entries Informing Service Evaluation
PT Kereta Api Indonesia (Persero) continues to strengthen service quality by involving customers in the company’s evaluation, innovation, and development processes. Based on the Customer Satisfaction Survey for the first half of 2026, KAI’s Customer Satisfaction Index (CSI) reached 4.53 on a scale of 5, an increase of 0.01 points compared to the 2025 figure of 4.52.
During the same period, KAI recorded 3,249,842 customer voices on social media. This data consists of inquiries, appreciation, suggestions, criticisms, and service-related reports, which serve as material for understanding customer needs and determining follow-up actions at every stage of the travel experience.
KAI President Director Bobby Rasyidin stated that the company’s sustainability is built on its ability to listen to, understand, and respond to public needs.
“Our spirit is to serve more. Therefore, the voice of the customer will continue to be integrated into KAI’s innovation and development going forward. Customers provide direct perspectives on the services they experience, enabling every decision to be more relevant, measurable, and responsive to the public’s travel needs,” said Bobby.
According to him, survey results and customer feedback play an essential role in shaping service improvements, facility development, technology utilisation, and workforce competency enhancement.
“A strong satisfaction score must be maintained, while customer input must be translated into tangible improvements. We want every development at KAI to have a strong connection with public needs,” he added.
KAI Vice President of Corporate Communication Anne Purba explained that the CSI for the first half of 2026 was obtained through face-to-face interviews with 3,160 respondents across nine Operational Areas and four Regional Divisions. Respondents were customers who had used KAI services at least twice in the past six months.
The measurement covered customer experiences at stations and onboard trains, as well as services including LRT Jabodebek, LRT South Sumatra, Tourism Trains, and Public Service Obligation (PSO) trains. The survey used a scale of 1 to 5 and evaluated both physical and non-physical attributes.
“The survey helps KAI gain a comprehensive view of the customer journey, from information search, ticket purchase, arrival at the station, boarding process, onboard travel, to the handling of customer needs,” Anne explained.
Based on service objects, the customer satisfaction index for onboard services increased by 0.05 points, from 4.55 in the second half of 2025 to 4.60 in the first half of 2026.
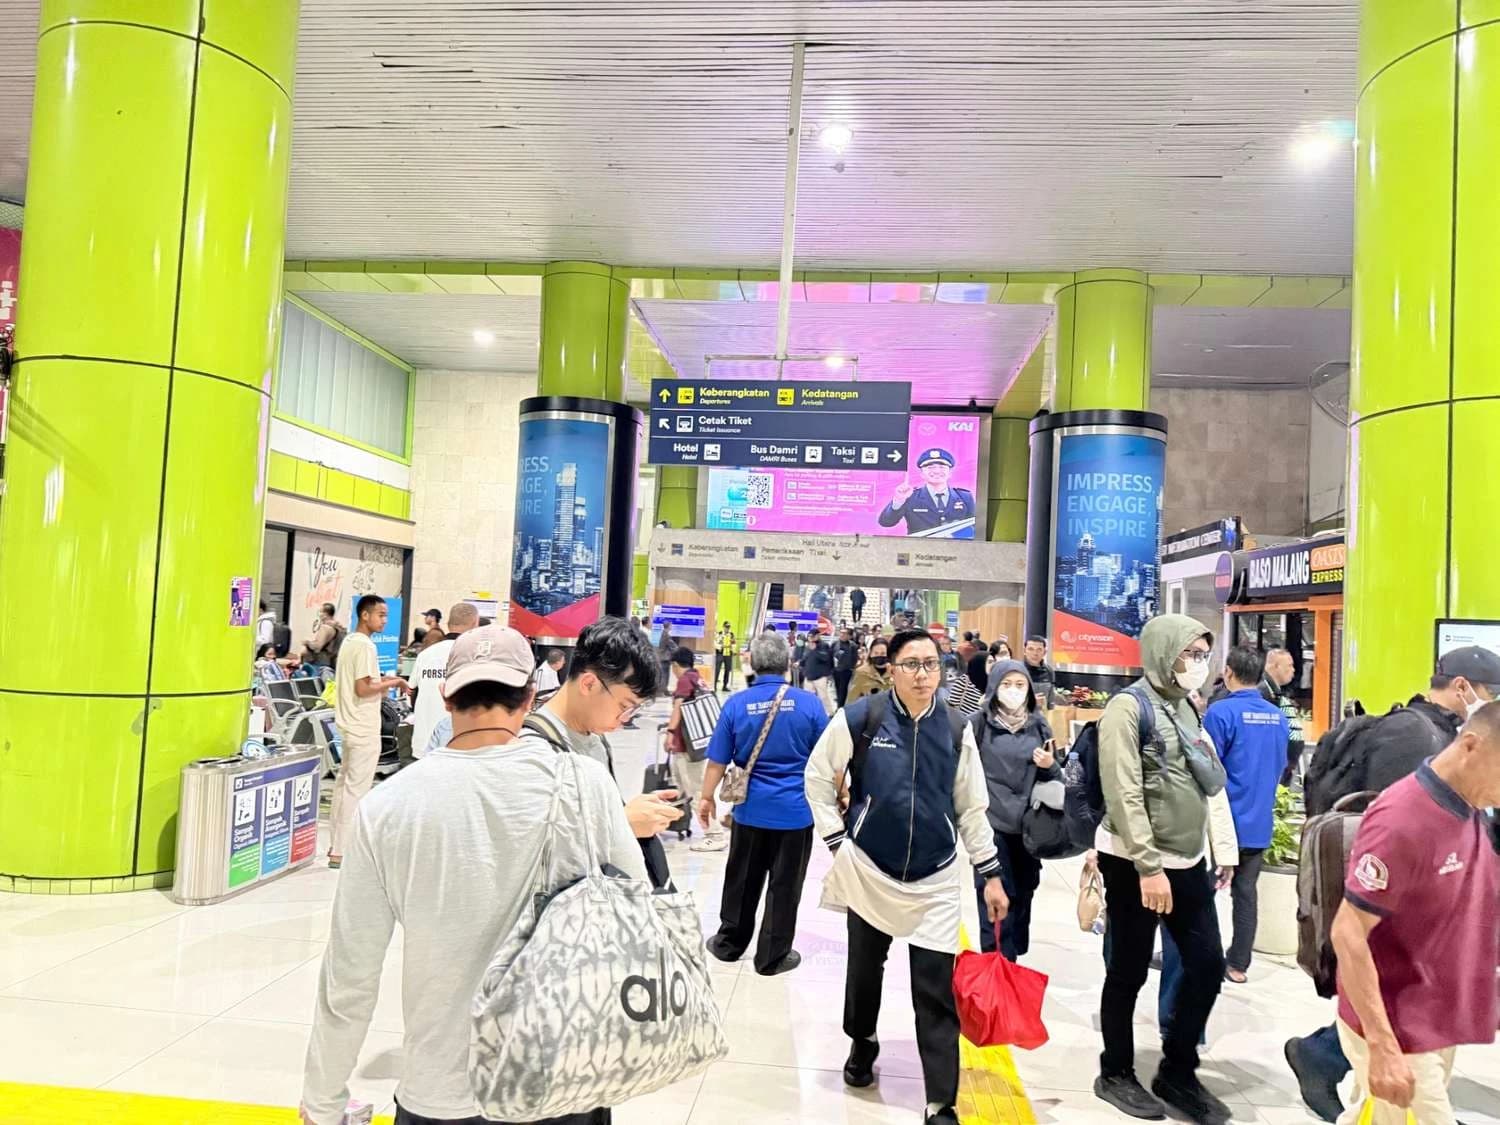
The satisfaction index for station services was recorded at 4.46, compared to 4.50 in the previous survey. This result has become a focus for KAI to further improve facility quality and customer experience in station areas.
From a service characteristic perspective, the non-physical aspect index increased from 4.58 to 4.61, while the physical aspect index stood at 4.46. These corporate survey results were based on assessments from 2,680 respondents for station and train services.
For onboard services, staff friendliness received the highest score of 4.72, followed by punctuality at 4.68, travel information at 4.61, safety at 4.59, passenger cabins at 4.56, dining cars at 4.54, and toilets at 4.51.
For station services, staff friendliness scored 4.62, information accuracy and service timeliness 4.57, fares and ticketing 4.50, boarding areas 4.39, ticket purchasing 4.38, customer service rooms 4.37, and waiting areas 4.34.
“Staff friendliness, punctuality, travel information, and safety received high ratings from customers. These aspects will be maintained through service standards, supervision, evaluation, and continuous workforce competency development,” Anne said.
Throughout the first half of 2026, KAI monitored 3,249,842 customer voices on social media. This monitoring provides insights into customer experiences, needs, and concerns expressed openly across various digital platforms.
The information is analysed based on conversation themes, service types, regions, sentiment, and urgency levels. The results are then used as input for relevant units to verify and prepare follow-up actions.
“Surveys provide structured measurement, while social media conversations offer fast and broad context. Combining both helps KAI understand which aspects are appreciated and which areas still require attention,” Anne added.
The figure of 3,249,842 customer voices differs from the number of interactions handled directly through service channels. Customer voices represent all monitored conversations on social media, while service channel interactions refer to communications received and handled via social media, email, WhatsApp, telephone, and other related channels.
Based on KAI’s service channel data, there were 2,205,691 customer interactions during the first half of 2026. This includes 1,380,724 social media interactions, 132,981 email interactions, 231,030 WhatsApp interactions, 16,764 outbound communications, and 444,192 inbound communications.
Taking into account approximately 11.28 million interactions handled from 2022 to 2025, the cumulative number of customer interactions through KAI service channels up to the first half of 2026 reached approximately 13.49 million.
“Each channel has different characteristics. However, all are used to capture customer needs, provide information, assist in resolving issues, and strengthen the foundation for service evaluation,” Anne noted.
Survey results were analysed using Importance–Performance Analysis to map aspects considered important by customers and the level of satisfaction they experience.
Based on the analysis for the first half of 2026, several aspects identified as priorities for improvement include station waiting areas, boarding areas, customer service rooms, fares and ticketing, and onboard train toilets.
For station waiting areas, customer concerns include comfort, cleanliness, seating availability, lighting, and temperature. In boarding areas, feedback relates to cleanliness, facilities, boarding flow, and ease of using the Face Recognition Boarding Gate.
For customer service rooms, customers highlighted the importance of desk and chair availability, queue seating, queue numbering systems, cleanliness, and overall comfort.
Regarding fares and ticketing, customer feedback relates to price suitability, class and fare variations, ease of obtaining tickets, and clarity of travel regulations. Meanwhile, for onboard toilets, customer concerns include cleanliness, water availability, jet showers, tissue, hand soap, waste bins, and air fresheners.
“Survey data and customer voices must lead to operational actions. Each related unit needs to translate these findings into improvements with clear targets, timelines, and evaluations,” Anne emphasised.
Survey results also show variations in service performance across regions. Operational Area 3 Cirebon recorded the highest service object CSI at 4.71, consisting of a station CSI of 4.63 and onboard CSI of 4.79.
Operational Area 5 Purwokerto recorded the largest CSI increase, rising by 0.28 points compared to the previous survey. In the physical aspect, Operational Area 3 Cirebon achieved the highest score at 4.61, and also recorded the highest non-physical aspect score at 4.82.
In terms of station cleanliness, Cirebon Station and Surabaya Pasar Turi Station achieved the highest scores at 4.58. For train service cleanliness by region, Operational Area 6 Yogyakarta recorded the highest score at 4.76.
KAI will use the survey results as a reference for formulating follow-up actions at the central, operational area, and regional division levels.
“Our target is to maintain aspects that have received positive ratings and accelerate improvements in service points that still require attention. Customer feedback serves as the foundation to ensure service development is more targeted and can be experienced in every journey,” Anne concluded.
VP Corporate Communication KAI